Showing posts with label bioinformatics. Show all posts

Friday, 8 September 2017

Some highlights of Genome 10k and Genome Science 2017

Everyone comes away with different highlights from a conference, as we each see it from the perspective of our own research, but here were some of the highlights for me of Genome 10k and Genome Science 2017. The conference had multiple tracks so there were many talks I missed. The conference was also live tweeted by many under hashtag #g10kgs2017.
  1. New technology: Nanopore sequencing was mentioned by many speakers, but often from people who were just about to use it for the next step in their research. Long reads were mentioned frequently, and PacBio was still a contender for long read sequencing in talks and posters. Optalysys was advertising a hardware approach to sequence alignment, using light detected after passing through two images representing the sequences ("comparison as fast as the speed of light", except for the time it takes to refresh the images). 
  2. Assembly of long reads and assembly analysis: Those who were using long reads were often using this to produce a whole genome, and were therefore attempting assembly, though many fragments remain even with long reads. Canu was mentioned regularly during the talks, as was FALCON, and miniasm during informal chat. John Davey's talk describing detective work to understand the genome of red algae extremophile Galdieria sulphuraria stood out. After assembly he counted chromosomes by looking for telomeres and the end-of-chromosome read alignment, and still found puzzling questions: Could this 14Mbp organism have 72 chromosomes? Do some of them share regions? 
  3. Haplotyping: Sam Nicholls gave an excellent talk about the Metahaplome and resolving haplotypes in a metagenome. PacBio users now have FALCON-Unzip to phase diploid genomes assembled with FALCON.
  4. Comparative genomics, genome alignments and lineage tracing: After the genomes are assembled, the eukaryote researchers are busy comparing their species with other species (often using Cactus). This seemed to be a common topic. Comparing genomes across species is compute-intensive/expensive. Within-species comparison/alignment was discussed by Bernardo Clavijo, who had many wheat genomes to merge and used skip-mers for the alignment seeds. Graph genomes were mentioned briefly but are not yet used. Alternative RNA splicing was a topic of interest for several speakers.
  5. GC content and GC biases: seem to be responsible for everything, including undersampling for short read sequencing, missing genes in the fat sand rat, photosynthetic efficiency and the efficacy of natural selection. Steve Kelly's talk was fascinating. Plants need different amounts of nitrogen for photosynthesis and this corresponded to the GC content and codon usage of their genomes. So photosynthetic efficiency can be predicted by GC content. He went on to describe how increasing atmospheric CO2 will lead to increased mutation and speciation rate in plants.
  6. Animals with superpowers: Researchers studying animals have all the best stories. There were bats that live forever and don't get cancer (well at least 43 years), mice that can have their fur or limbs removed and have no problem regenerating them, Tasmanian devils transmit cancer by biting and passenger pigeons were once the most abundant bird in the US, migrating in flocks so dense that the sky was darkened, but are now extinct.
  7. Sketches by Alex Cagan: He drew each of the talks in the main room at lightning speed, uploading the sketched to Twitter immediately after each talk. The main room concentrated on the eukaryote genomes, so if you're interested in his summaries, see them all at https://twitter.com/search?q=%23g10kgs2017%20atjcagan
Other observations:
  • The sponsors and stall holders were mostly selling lab automation of one kind or another. Clearly, automation is what genomics researchers are likely to buy.
  • "We are a chemostat for microbes" - Lindsay Hall
  • "Strain resolution is not clustering but deconvolution" - Chris Quince
  • PerkinElmer have put a lot of work into understanding the biases of 16S kits for different hypervariable regions. 
  • Several presentations that confessed "Most of this work was done by my student" (then let your student give the presentation!). Also several people suggesting a useful paper by X where X was the last author rather than the first author. Give credit to the first author!

Monday, 10 April 2017

Visiting JG Mainz University

I've just returned from a two week visit to Johannes Gutenberg University Mainz, where I was hosted by Andreas Karwath in the Data Mining group of the Dept of Informatik. I was there to pick up new research ideas, to get away from admin/teaching duties for a while and to share what we've been working on lately. 

The University at Mainz is a large campus based university on the outskirts of the town, on the beautiful river Rhine. It's named after the inventor of the printing press in the west, Johannes Gutenberg. The Gutenberg museum is excellent, tracing books from wax tablets through handwritten parchments, to moveable type print, then the industrial revolution, typewriters and high volume printing. This is a museum about the value of information and its transmission, and the technology invented to do this. There was even a special exhibition about the Futura font, as an added bonus. This is the geometric circles-and-lines font used in posters for "2001 A Space Odyssey", and on the Apollo 11 moon plaque ("We came in peace for all mankind"), and in so much future-looking advertising and propaganda in the Art Deco inspired 1930s era, both in Germany and beyond.

It was interesting to be embedded in a data mining group, rather than bioinformatics for a change. They have a broad range of application areas, but also happily switch technology (neural nets, relational learning, topic models, matrix decomposition, graphs, rs-trees and more) as the application area needs. Also very interesting to see in which ways a different country's research culture is different. It's not REF-dominated like the UK, so more they're more free to focus on quick-turnaround peer-reviewed compsci conference publications, and perhaps more hierarchically structured, as only the few professors have permanent positions. And yet it's still the same. University departments are international places and share much in common, whichever country you're in: same grant applications, student supervisions, seminar talks, dept silos, etc.

It was great fun to be there, and they were excellent hosts. At the same time, it was strange and sad to be a British person on exchange in Germany during the week that the UK sent article 50 to the EU. International collaborations are so important to research that leaving the EU is bound to be hugely detrimental to us UK academics. We need more exchange, not less.

Tuesday, 4 April 2017

The metahaplome

A sample of water, soil or gut contents will contain a whole community of microbes, cooperating and competing. We now have the sequencing technology to begin to explore these communities, to find out the variation that they possess. This can be useful in the search for new anti-microbials, or in the search for better enzymes for biofuels. However, the sequencing technology is not quite there yet. The very short length of the reads, together with the errors introduced, combine to make the problem of reassembling the underlying genomes much more complex.

We introduce the concept of the 'metahaplome': the exact sequence of DNA bases (or "haplotype") that constitutes the genes and genomes of every individual present. We also present a data structure and algorithm that will recover the haplotypes in the metahaplome, and rank them according to likelihood.

Our preprint about the metahaplome is now available at bioRxiv: Probabilistic Recovery Of Cryptic Haplotypes From Metagenomic Data.

Wednesday, 3 August 2016

Holding an internal research workshop

We have just held the 4th Aberystwyth Bioinformatics Workshop. It's a one-day workshop, held with no budget, and intended to be a mostly internal informal research networking event.

We call for 5 min lightning talks, 20 minute longer talks, demos of software, and posters. We end up with a good mixture of both. We especially encourage new PhD students to present, and for all attendees to be friendly and supportive rather than combative in their questions. Registration is done by a very simple Google form (name, email, what kind of talk, title of talk/poster, any other comments). Registration closes one week before the workshop. Tea and coffee is acquired somehow, a room is booked, talks are arranged into a programme, and then away we go.
Aber Bioinformatics Workshop attendees July 28th 2016. Photo by Sandy Spence.

 Each time we've done this we have ended up with a full day of talks. People use it to let others know what they're working on, to practise a talk they're preparing for an external conference, to ask for advice on their work, to describe the state of the compute cluster facilities and to just introduce new people. Bioinformatics at Aberystwyth is mostly done within the biology departments of IBERS, but this meeting allows Computer Science and Maths people to join in, and make interdisciplinary links. Finally we go down to the pub, and continue the discussions there.

It's a very low cost minimal preparation way to bring together a group of otherwise independent researchers. Many bioinformaticians feel that they are either the only one in their group, or else, that they're not really a bioinformatician at all and somehow masquerading as one. I've learned a great deal from each workshop that we've had, and its just great to find that we do have a surprisingly strong local support network in such a specialist field.

Monday, 28 March 2016

Goldilocks: census your genomes

Goldilocks is a new tool written by Sam Nicholls for counting interesting properties of genomes. It's very easy to install ("pip install goldilocks") and has a detailed user manual.

So, let's have a look at GC count across each of the chromosomes of Sorghum. Sorghum is a plant that is a reasonably close relative to Miscanthus, which is extensively studied here in Aberystwyth. I downloaded the chromosome assembly of sorghum from RefSeq. Here's the plot, showing amount of GC on the y-axis and position along the chromosome on the x-axis. The 10 Sorghum chromosomes are all shown stacked up in one plot panel.
The Python code for this using Goldilocks to do this plot is as simple as:

sequence_data = { 
    "sorghum" : {"file": "./sorghum.fna.fai"},
}
g = Goldilocks(GCRatioStrategy(), sequence_data, length="500K",
               stride = "1000K", is_faidx = True)
g.plot("sorghum", title="GC content of sorghum chromosomes")

The dip in GC for the centromere of each chromosome is obvious, except for chromosomes 2 and 6.

A similar but inverted pattern can be seen if we look at the number of Ns along the genome:

So, what's different about the centromeres in chromosomes 2 and 6? Why are they not so visible? Another way to spot them would be to look for a motif known to be in the centromeres. Centromeres have many repeats, and a repeat region known to be found in sorghum centromeres is CEN38. Let's choose a short motif from the sequence for CEN38, say "CCTAATG", and census that.

There's clearly plenty of this motif found in chromosomes 2 and 6, and found where we might expect a centromere to be (also lots of this motif in the centromeres of chr 3 and chr 5 too). But it's not found in all chromosomes. Could it be that CEN38 varies its sequence in the other chromosomes, and so doesn't have precisely that motif? Or that too many Ns in the other chromosomes stop CEN38 being characterised?

This is just a simple demonstration of how Golidlocks can be used to explore questions. And questions lead to more questions, and then many a happy hour can be spend browsing your genomes. Goldilocks can also be used to export details about which regions are the most interesting (hence the name: it finds regions that are "just right", for whatever your "just right" criterion might be).

Enjoy browsing your genomes! Goldilocks paper, Goldilocks docs, Goldilocks source code.

Thursday, 17 December 2015

Data science and a scoping workshop for the Turing Institute

In November I went to a workshop to discuss the remit of the Alan Turing Institute, the UK national institute for data science, with regard to the theme of "Data Science Challenges in High Throughput Biology and Precision Medicine". This workshop was held in Edinburgh, in the Informatics Forum, and hosted by Guido Sanguinetti.

The Alan Turing Institute is a new national institute, funded partly by the government, and partly by five universities (Edinburgh, UCL, Oxford, Cambridge, Warwick). The amount of funding is relatively small compared with that of other institutes (e.g. the Crick) and seems to be enough to fund a new building next door to the Crick in London, together with a cohort of research fellows and PhD students to be based in the new building. What should be the scope of the research areas that it addresses and how should it work as an institute? There are currently various scoping workshops taking place to discuss these questions.

Data science is clearly important to society, whether it's used in the analysis of genomes, intelligence gathering for the security services, data analytics for a supermarket chain, or financial predictions for the city. Statistics, machine learning, mathematical modelling, databases, compression, data ethics, data sharing and standards and novel algorithms are all part of data science. The ATI is already partnered with Lloyds, GCHQ and Intel. Anecdotal reports from the workshop attendees suggest that data science PhD students are snapped up by industry, ranging from Tesco to JP Morgan, and that some companies would like to recruit hundreds of data scientists if only they were available.

The feeling at the workshop seemed to be a concern that the ATI will aim to highlight the UK's research in the theory of machine learning and computational statistics, but risks missing out on the applications. The researchers who work on new and cutting edge machine learning and computational statistics don't tend to be the same people as the bioinformaticians. The people who go to NIPS don't go to ISMB/ECCB. And KDD/ICML/ECML/PKDD is another set of people again. These groups used to be closer, and used to overlap more, but now they rarely attend each others' conferences. Our workshop discussed the division between the theoreticians who create the new methods but prefer their data to be abstracted from the problem at hand, and the applied bioinformaticians, who have to deal with complex and noisy data, and often apply tried and tested data science instead of the latest theoretical ideas. To publish work in bioinformatics generally requires us to release code and data, and to have shown results on a real biological problem. To publish in theoretical machine learning or computational statistics, there is no particular requirement for an implementation of the idea, or to demonstrate its effectiveness on a real problem. There is also a contrast between the average size of research groups in the two areas. Larger groups are needed to produce the data (people in the lab to run the experiments, bioinformaticians to manage and analyse the data, and these groups are often part of larger consortia) whereas the theoreticians are often cottage-industry style research with just a PI and a PhD student. How should these styles of working come together?

Health informatics people worry about access to data: how to share it, get it, and ensure trust and privacy. Pharmaceuticals worry about dealing with data complexity, such as how to analyse phenotype from cell images in high throughput screening, having interpretable models rather than non-linear neural networks, and how to keep up with all the new sources of information, such as function annotations via ENCODE. GSK now has a Chief Data Officer. Everyone is concerned about how to accumulate data from new bio-technologies (microarrays then RNA-seq, fluorescence then imaging, new techniques for measuring biomarkers of a population under longitudinal study). Trying to keep up with the changes can lead to bad experiment design, and bad choices for data management.

There was much discussion about needing to make more biomedical data open-access (with consent), including genomic, phenotypic and medical data. There seemed to be some puzzlement about why people are happy to entrust banks with their financial data, and supermarkets with purchase data, but not researchers with biomedical data. (I don't share their puzzlement: your genetic data is not your choice, it's what you're born with, and it belongs to your family as much as it belongs to you, so the implications of sharing it are much wider).

All these issues surrounding the advancement of Data Science are far more complex and varied than the creation of novel and better algorithms. How much will the ATI be able to tackle in the next five years? It's certainly a challenge.

Tuesday, 29 September 2015

An executable language for change in biological sequences

A discussion on Twitter about whether there was a language for representing sequence edits prompted me to post my draft proposal for such a language. http://figshare.com/articles/Draft_proposal/1559009

Comments, criticism, collaboration and competition welcome. Hopefully I'll submit it shortly.

Thursday, 30 July 2015

ISMB/ECCB 2015

ISMB/ECCB 2015 (and HitSEQ 2015) was held in Dublin, just across the Irish Sea from us here in Aberystwyth. So off we went, to find out the latest research in bioinformatics. There were many parallel tracks, but the recurring themes of the talks I attended were:
  • lots of work on human genomics, particularly disease, particularly cancer
  • single cell analysis, finding variation (SNVs) from clonal populations, haplotype resolution
  • sequencing technologies: RNA-seq, sequencing of methylation, Hi-C sequencing, ultra deep sequencing and lots of promise for long reads
  • reference sequences: most people were working with a reference rather than de-novo
  • training bioinformaticians, maintaining software, keeping a core of bioinfomaticians
  • the Burrows Wheeler transform - does it solve every large-data problem?
  • graphs, and ways of cleaning up graphs, adding weights to graphs, finding minimal/maximal components of graphs
There wasn't very much about the following topics, though they did make occasional appearances:
  • text mining
  • metagenomics
  • multi-omics
Too hard? Dropping out of favour? Or perhaps people working in these areas just don't attend this particular conference?

Aberystwyth PhD students with their posters: Stefani Dritsa, Sam Nicholls, Tom Hitch, Francesco Rubino

The keynote talks tended to be of the kind that long-established group PIs do well. They're the "Here's a summary of all the work my group has been doing for the past 5-10 years to answer this particular biological question" talk. While I admire their determination and group size, I feel that they're speaking only to a subgroup of the audience with this kind of talk, and that a keynote should somehow also aim to more generally inspire the audience to go out and do great work, have new ideas, think in new directions, and not just to have learned a little more about that specific subject area. The far more off-the-wall non-keynote talk by David Searls about a bioinformatic analysis of James Joyce's book Ulysses fascinated the audience, and provided exactly that. He received a huge round of applause.


The jobs notice boards were full (below are just 2 of the notice boards). More bioinformaticians are clearly needed!


Many of the conference talks are now online, but you need to be a member of ISCB to see them http://www.iscb.org/ismb-mm/media-ismbeccb2015. The papers are also collected in a special ISMB/ECCB issue of Bioinformatics.

Monday, 8 June 2015

Aber Bioinformatics Workshop

Last week we had the 2nd Aber Bioinformatics Workshop. It's an internal workshop for work-in-progress talks, posters and networking and the aim is for us all to keep up with what's going on in Aberystwyth in bioinformatics across departments and institutes. We had a wide range of talks on genomics and sequence analysis, metabolomics, optimising proteins, population and community modelling, data infrastructure and other topics. Here's the programme for the day.

Photo of all the attendees, taken by Sandy Spence
It was great to see that we now have so many people interested and working in bioinformatics, despite the difficulties in trying to understand all sides of the story (the biology, the computing, the statistics, etc). We talked about the range of modules and courses that were available to help people get up to speed with this, and how we should do more to let new PhD students know what is available. Also, now that we've had the workshop, hopefully we're more aware of the expertise and facilities available here in Aber, so we now know who to approach with questions and ideas.

At the end of the day we moved down to the pub, and continued to discuss more random topics: beetles, plant senescence, hens, temperature sensing wires for computer clusters, and concordance in Shakespeare texts. I'm sure this all helps in the long run.

Thursday, 21 May 2015

How much is enough?

How much is enough? This question seems to crop up very frequently when analysing data. For example:
  • "How much data do I need to label in order to train a machine learning algorithm to recognise place names that locate newspaper articles?"
  • "Is my metagenome assembly good enough or do we need longer/fewer contigs?"
  • "What BLAST/RAPSearch threshold is close enough?"
  • "Are the k-mers long enough or short enough? (for taxon identification, for sequence assembly)"
Sadly there's no absolute answer to any of these. It depends. It depends on what your data looks like and what you want from the result. It also depends on how much time you have. It depends what question you really wanted to answer. What's the final goal of the work?

Sometimes there are numbers to report, measures that give us an idea of whether the process was good enough, after we've done the expensive computation. We can report various statistics about how good the result is, such as the N50 and its friends for sequence assembly, or the predictive accuracy for a newspaper article place name labeller. Which statistics to report are highly questionable. Does a single figure such as the N50 really tell us anything useful about the assembled sequence? It can't tell us which parts were good and which parts were messy. Do we really need lots of long contigs if we're assembling a metagenome? Perhaps the assembly is just an input to many further pipeline stages, and actually, choppy short contigs will do just fine for the next stage.

PAC learning theory was an attempt in 1984 by Leslie Valiant to address the questions about what was theoretically possible with data and machine learning. For what kinds of problem can we learn good hypotheses in a reasonable amount of time (hypotheses that are Probably Approximately Correct)? This led on to the question of how much data is enough to make a good job of machine learning? Some nice blog posts describing PAC learning theory and how much data is needed to ensure low error do a far better job than I could of explaining the theory. However, the basic theory assumes nice clean noise-free data and assume that the problem is actually learnable (it also tends to overestimate the amount of data we'd actually need). In the real world the data is far from clean, and the problem might never be learnable in the format that we've described or in the language we're using to create hypotheses. We're looking for a hypothesis in a space of hypotheses, but we don't know if the space is sensible. We could be like the drunk looking for his keys under the lamppost because the light is better there.

Perhaps there will be more theoretical advances in the future that tell us what kinds of genomic analysis are theoretically possible, and how much data they'd need, and what parameters to provide before we start. It's likely that this theory, like PAC theory, will only be able to tell us part of the story.

So if theory can't tell us how much is enough, then we have to empirically test and measure. But if we're still not sure how much is enough, then we're probably just not asking the right question.

Saturday, 21 June 2014

The Genome Game with Countdown and High Score Table

The Genome Game now has a part where you have to guess the rules (correspondence between genotype and phenotype) before the time runs out. If you guess correctly then you get to join the (local storage) high score table. It's also bilingual now, so you can play in the medium of Welsh.

http://genome-game.dcs.aber.ac.uk/game


Monday, 3 March 2014

Western Mail article about bioinformatics

As part of the Welsh Crucible I had an article in the Western Mail today. How computer science can solve problems in biology. We were asked to explain our work in 400-500 words (they chose the title). Much more challenging than I thought it would be, because that's not very many words.

Thursday, 6 February 2014

Bioinformatics and computational biology: 500 years of exciting problems?


I gave a talk at Warwick University, Department of Computer Science in January 2014. A look at the intertwining of computer science and biology from the days of Turing through the present and on to the future, including some of my research along the way. 
In a 1993 interview, Donald Knuth worried that computer science in the future will be "pretty much working on refinements of well-explored things", whereas "Biology easily has 500 years of exciting problems to work on". I'll describe some of the bioinformatics and computational biology that I've been working on. My talk included a little about where the field has come from, where it's going in the future, and whether it should be considered a branch of computer science at all.
The slides are online at Figshare.

Monday, 25 March 2013

The genome game


We've made an HTML5/Javascript educational game for teaching children about bioinformatics. You can try out the game on our webserver, or download it, fork it and develop it for your own purposes.

The idea is that we have 4 binary digits controlling 4 aspects of a cute creature's phenotype (eye colour, head colour, body colour and number of legs). The binary digits are big clickable buttons, which toggle the bit value and correspondingly change the creature. We can use this initial button-clicking exercise to talk about combinatorics and binary numbers: how many different creatures can be made by changes to 4 bits?

Then we show the underlying rules. These are the equivalent of "if-then-else" rules, defining how the bit values control the phenotype. The rules can be changed, so the children can choose which bit controls which characteristic, and also choose colours and leg numbers.

The genome game at National Science Week

Finally we can "Make population". This creates a random population of 5 creatures, all generated from the current set of rules, and it hides the rules. Now the game is to have a friend who didn't see the rules guess what the underlying rules were. They can see the 5 creatures and the genomes of each creature. Sometimes it's easy to work out the rules, and sometimes the rules can't be completely determined. It depends on the random 5 creatures. Sometimes all the creatures with blue eyes also happen to have 6 legs, and then we just can't tell which of the 4 bits is responsible for which characteristic.

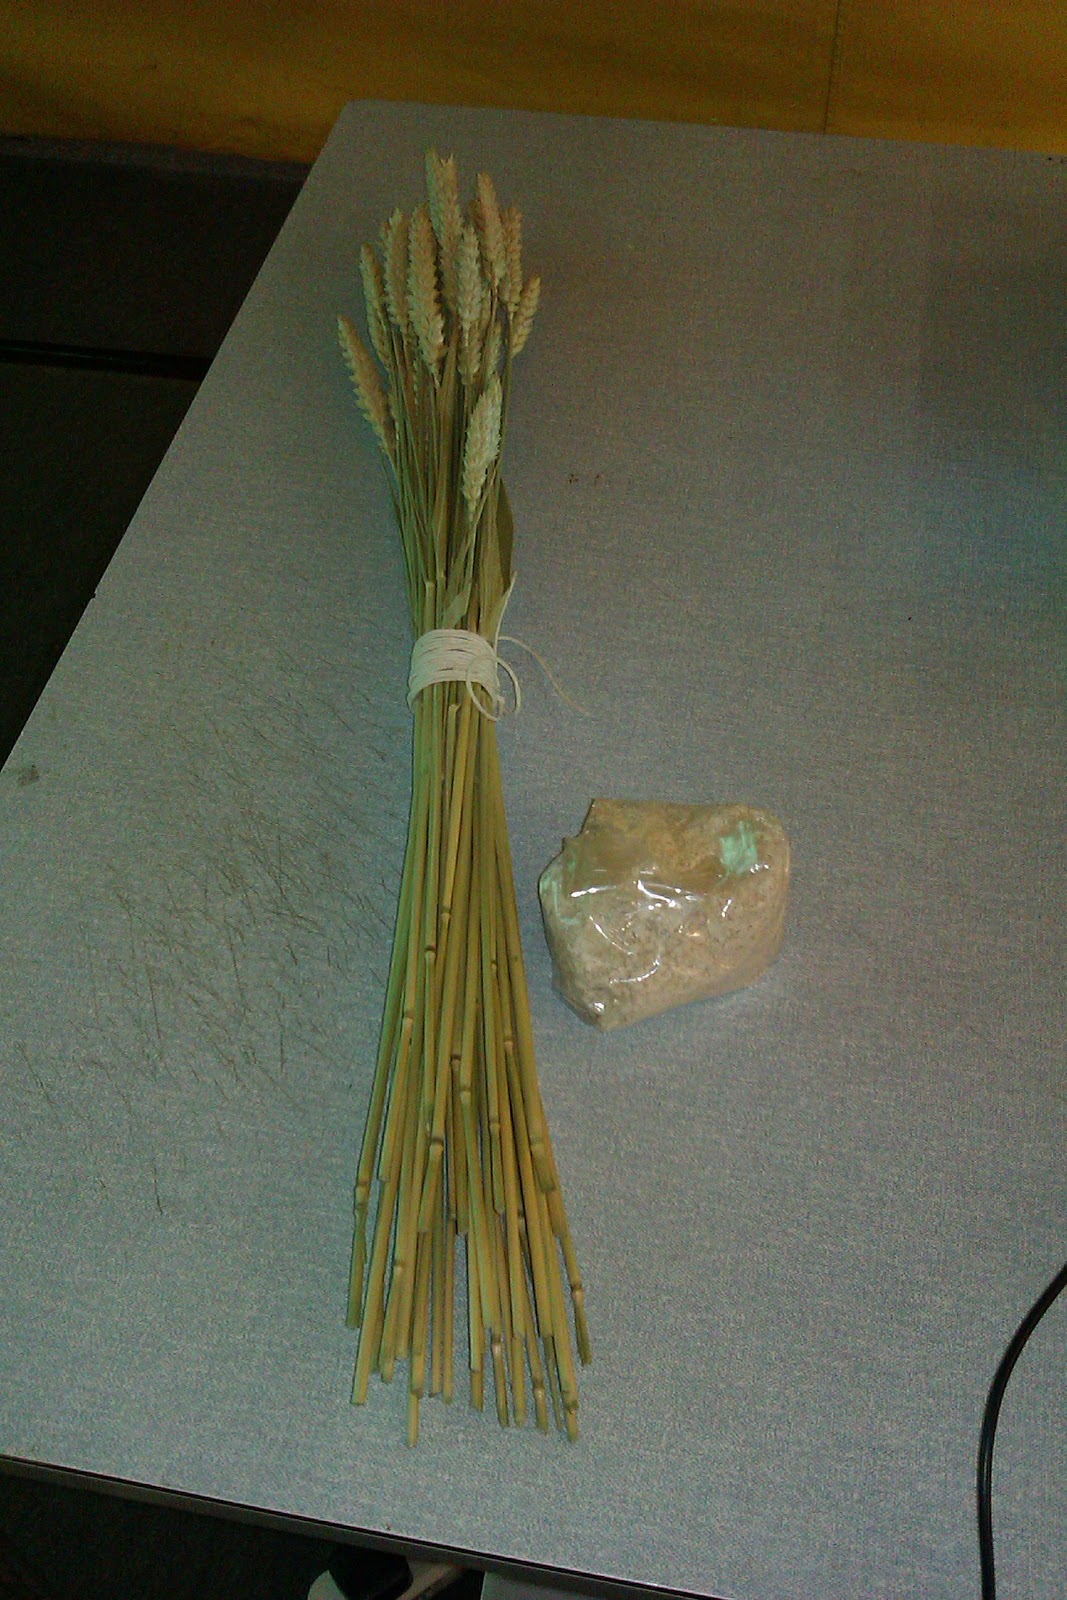
We finish up the discussion by asking how many genes the children think are in baker's yeast (approx 6,000, easy to get hold of a bag of yeast, and they can guess what it is and what it does). They'd guess at "1? 2? 4? millions?" After this we asked them to guess how many genes in a human (approx 20,000). And describe how about 16 genes are actually responsible for your eye colour, not just one. And finally, ask how many genes in wheat (current estimate approx 100,000 or more). The look of astonishment at the complexity of wheat was a common reaction, quickly followed by "Why?". So we tell them that's what scientists are currently trying to find out: what do all our genes or the genes in yeast or wheat actually do? How many representatives of a population would scientists need to determine what the 100,000 genes in wheat do? And we tell them that if they want to work in bioinformatics when they grow up, then they could find out the answers for themselves.

Wheat and yeast: how many genes do they have?

How did this game come about? We have a BBSRC funded project on the application of multi-relational data mining to the problem of finding which parts of an organism's genotype are responsible for its phenotype. This problem is often called GWAS (genome wide association studies) or marker-assisted selective breeding. As part of the application for funding, we said that we'd do some public outreach activities, making a bioinformatics game for children that could be used as part of the Technocamps activities, and represented the research problem that we were working on. The game is obviously a highly simplified view of the research, but still does give an idea of how hard the problem is!

Wednesday, 6 June 2012

Alan Turing, the first bioinformatician

This is the Alan Turing centenary year, and Alan Turing would have been 100 years old this month (on 23rd June) if he had lived this long. As well as inventing computers, theories of decidability, computability, computational cryptography and artificial intelligence, just before his death he also studied the relationship between mathematics and the shapes and structures found in biology. How do patterns in plants, such as the spiral packing of the seeds found in the head of a sunflower, come about? This year, in a big experiment, devised by Prof Jonathan Swinton to celebrate his centenary, sunflowers are being grown across the country. The seed heads will be collected, their patterns counted, then hopefully the results will demonstrate the relationship between Fibonacci numbers and biological growth that Turing was investigating. We're growing two sunflowers here in the Dept of Computer Science at Aberystwyth University as part of this experiment. Their names were voted on by the Department, and "one" and "zero" were chosen.


Turing used an early computer at Manchester (the Ferranti Mark 1, the first commercially available general purpose electronic computer) to model the chemical processes of reaction and diffusion, which could give rise to patterns such as spots and stripes. You can play with a Turing reaction-diffusion applet online, which shows how changes to the diffusion equation parameters produce different patterns. Turing wrote, near the end of his 1952 paper The Chemical Basis of Morphogenesis that:
"Most of an organism, most of the time, is developing from one pattern into another, rather than from homogeneity into a pattern. One would like to be able to follow this more general process mathematically also. The difficulties are, however, such that one cannot hope to have any embracing theory of such processes, beyond the statement of the equations. It might be possible, however, to treat a few particular cases in detail with the aid of a digital computer."

He then goes on to elaborate further on how computers have already been extremely useful to him in helping him to understand his models (no need to make so many simplifying assumptions). The fact that he actually used computers to investigate the models underlying biology, makes him the first bioinformatician / computational biologist. The fact that he could see the future, and could see how computers would enable us to model and explore the natural sciences makes him an amazingly visionary scientist.

Extra reading:

Saturday, 3 March 2012

De Bruijn graphs

De Bruijn graphs are currently a cornerstone of several genome sequence assembly algorithms. Nicolaas de Bruijn was a Dutch mathematician who died this year in February 2012. In 1946, he created the idea of the graph that is now named after him. The picture of him here is Copyright:MFO, and others can be seen at the Oberwolfach photo collection. I like to think he might be drawing graphs while resting on this bench. It looks like there's a football beside him, though he's hardly dressed for a game of football, in a tweed suit and tie.

The nodes of de Bruijn graphs are short sequences. There is an edge between two nodes if you could convert one sequence into another by shifting it along by one character and adding a new character at the end. So the nodes "AACAA" and "ACAAB" are allowed to be joined by an edge. In Haskell, you might say that tail node1 == init node2. In Python you might say node1[1:] == node2[:-1]. A very readable article in Nature Biotechnology describes how these graphs are used in sequence assembly. Basically, a subsequence size is chosen (for example, 32 characters), and all subsequences of this size that are found in your read fragment data then become nodes in a de Bruijn graph. We search for a good path through this graph after cleaning up some of the noise and errors and deciding what to do about loops. The path through the graph will tell you the final sequence.

At the moment, sequence assembly is still a big problem. A new genome is sequenced as a collection of short overlapping sequence pieces (short is usually anywhere between 32 and 500 bases at the moment), which then have to be painstakingly pieced together. There are errors in the sequencing, and repetitive regions, and this complicates the problem. The size of the data is also a problem. Plant genomes can have around 20 billion bases, so working with files and having enough memory to store data structures adds to the problem.

So much must have changed in de Bruijn's lifetime. Back in 1946 the structure of DNA was not clear. Watson and Crick's paper in 1953 was yet to come. Computers were yet to come. He wouldn't have known that more than 60 years later we'd be using his graphs to assemble whole genomes that were sequenced using the detection of fluoresence. What will we be doing 60 years from now that links maths, computer science, physics, chemistry and biology?